Debugging PHP, JSON and JavaScripts Application using PHP IDE
In this article we are looking at the use of PHP Editor and PHP Debugger for
developing applications using PHP, JavaScript and JSON. These applications employ
PHP scripts to serve the responses in JSON to JavaScript client side requests
made via Dynamic Script Injection or AJAX .
This technique was described in our PHP and JSON article.
We will start with a quick summary:
Why do you need PHP IDE?
Previously we looked at
using JSON with PHP
and discussed the advantages of
Dynamic script injection.
However, traditional print and echo statements debugging of PHP scripts is very
challenging if not impossible when these scripts are called by JavaScript via
Dynamic Dynamic script
injection, because the output of PHP script is sent right back to JavaScript that
called it. The output produced by PHP Script has to be correct to be displayed.
As you can guess, most of the problems in PHP ironically will be exactly around the
generation of this JSON output and you will have a Catch 22 situation: in order
to debug the PHP script you will need this script to work right!
PHP Editor integrated with the real
PHP debugger
comes to the rescue. However, PHP IDE has to be capable of interrupting the
execution of PHP script and automatically starting the debugging session when
the request to PHP script comes in. We liked the way it is done by DebugBreak()
PHP function provided by dbg –
PHP debugger
available in PhpED, PHP IDE
from NuSphere.
Setting Up JavaScript and PHP debugging
As always, at first let’s take a look at our system:
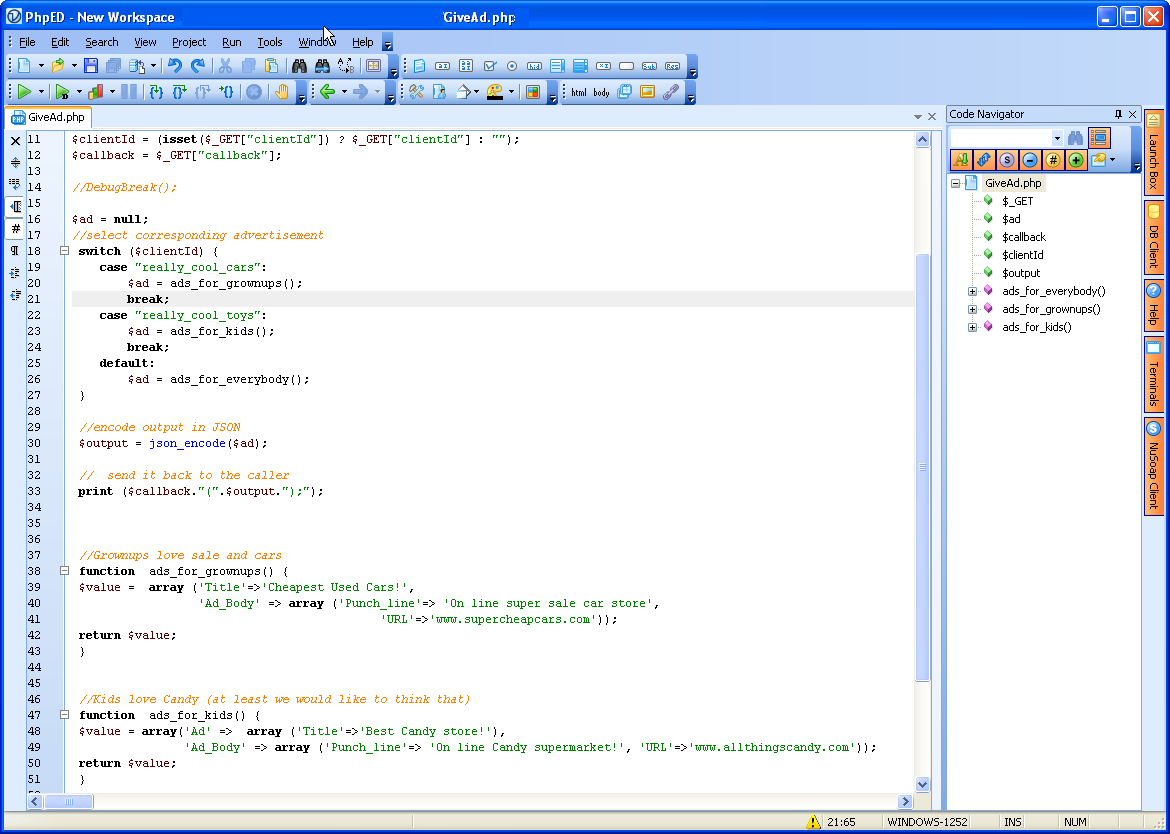
JavaScript is running embedded in a simple html page ShowAd.html representing your client’s website. It makes use of Dynamic Script Injection to make a call to your PHP script (GiveAd.php) and get back an advertisement that it needs to display. PHP script determines which ad to send back based on the client’s id provided by the JavaScript. We will use:
FireFox to display the HTML
FireBug to debug and step through the JavaScript in GetAd.js – the source is available here.
PhpED and its commercial version of dbg – PHP debugger to debug and step through GiveAd.php – the source is available here.
To invoke the debug session we placed the call to DebugBreak() in the beginning of GiveAd.php. Please note: you will get “undefined function” if you don’t have dbg extension loaded in your PHP.
Apache and PHP 5.2 installed as part of TechPlatform – free bundle from NuSphere
Except for PhpED any of these components can be replaced with equivalent tools.
Setting up PHP debugger and calls to DebugBreak()
For the purpose of this article we are running PHP Editor on the same machine with the Apache serving PHP and dbg extension.
Using NuSphere tools you can also debug your live production environment on Linux or any other platform as long as you can
access php.ini file on your server to setup loading of dbg debugger.
We will refer you to NuSphere dbg-wizard tool page
for more information explaining how to setup remote or local php debugging. Meanwhile, to setup the debugger on TechPlatform with PhpED, all you need to do is this:
Copy php_dbg.dll-5.2.x (dbg extension module) from
<PhpED install folder>debugger\server\Windows\x86 to
<TechPlatform install folder>\apache\php\ext
Open <TechPlatform install folder>\apache\bin\php.ini file and add the line
extension=php_dbg.dll-5.2.x
If you find any other php_dbg line there – comment that out. TechPlatform comes with free version of dbg and that’s most likely what you find – but you want to make sure that you are loading the commercial version of dbg. If you are using PhpED FREE trial - you still have fully functional commercial version of dbg in your PhpED trial install folder, as described above.
Please note that we are using php_dbg.dll-5.2.x because we are running the
latest version of TechPlatform that comes with PHP 5.2. You will find php_dbg extensions
for other PHP versions at the same place, under <PhpED install folder>debugger\server\Windows\x86, or
if you are debugging on Linux or other non-Windows platform,
dbg-wizard
will tell you where to locate your dbg module –
they all are under <PhpED install folder>debugger\server.
NuSphere also has detailed table of dbg modules for various platforms here –one page that is really hard to find!
Now, all you need to do is place this line in the beginning of GiveAd.php:
DebugBreak();
and you are good to go!
Here is the screenshot of GiveAd.php in PHP Editor: